 Posted by: Pete Nabozny, Associate Principal at CGR and co-owner of Tru Yoga
Over the next two weeks, Reconnect Rochester is going to publish a series of pieces that explore the issue of poverty in our region. These articles will focus primarily on the intersection of poverty with public transportation, sprawl, and community planning. But before we start, it is important to have a firm understanding of what the problem is and why it is so pernicious in our region.
How do we define poverty?
While the issues and proposed solutions to poverty are complex and multifaceted, the way we actually define of poverty in the United States is quite simple. A person lives in poverty if their household’s cash income is below a certain level.
And how do we determine that level? Despite considerable changes in society over the last 50 years, our modern day poverty threshold is simply based on the cost of food in 1963, adjusted for inflation and family size. Seriously, check it out.
The 2015 poverty thresholds are below…
| Household Size | Poverty Threshold |
| Single Person | $12,082 |
| Two People | $15,391 |
| Three People | $18,871 |
| Four People | $24,257 |
Whether or not one is determined to be in poverty is based on how the US Census Bureau defines cash income. Market earnings (usually a job) obviously counts. Social Security income, for both the elderly and the disabled, is also included. So are temporary assistance (traditional welfare), veterans’ benefits, and unemployment insurance compensation.
What doesn’t count? The Earned Income Tax Credit (EITC), food stamps, child care subsidies, health care programs like Medicare and Medicaid, housing subsidies, and a number of other programs. While the EITC or child care subsidies may help people enter or remain in the workforce, the tangible financial benefits of those programs are not included in the official poverty measure calculations.
The US Census Bureau has developed an improved measure, called the Supplemental Poverty Measure, that takes these other types of supports (and expenses) into account, but detailed data from that measure is unfortunately not available at the local level.
This helpful calculator lets you play with the national impact of government programs on the official and supplemental poverty measures, while this article explores the issue in more detail.
So while the actual poverty measure is a bit of a rough calculation, it still provides a widely understood and long term baseline to measure the prevalence of low-income individuals and families in a region, and is particularly attuned to measure improvements of market income among poorer members of society.
Characteristics of Poverty in Rochester
Over the past several years, a series of reports published by ACT Rochester and the Rochester Area Community Foundation have analyzed the issue of poverty in considerable detail. Anyone trying to fully understand the topic should spend some time with those extremely helpful studies.
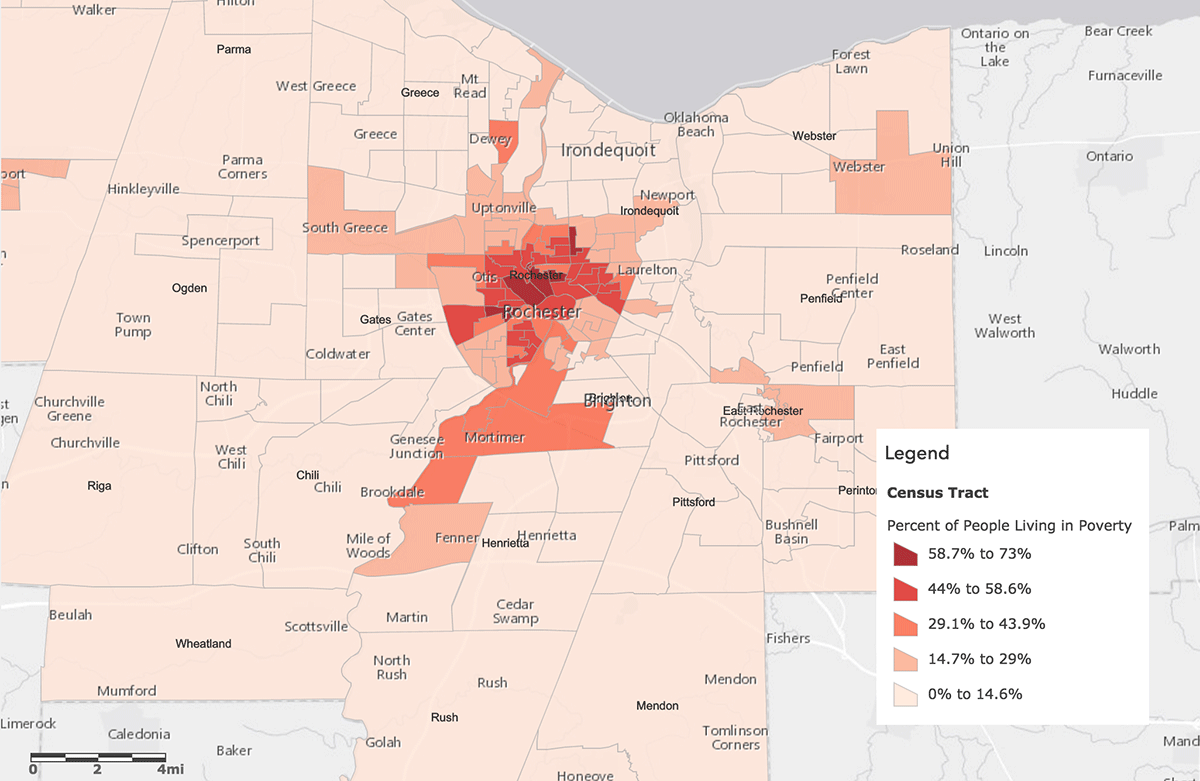
One key takeaway from those reports is that the overall rate of poverty in our region is actually quite unremarkable compared to national figures. According to the U.S. Census Bureau, at 14.6%, the Rochester metro rate is below the median for the largest 100 metropolitan areas—we rank #57. By contrast, the poverty rate in the City of Rochester is quite high relative to center cities in other regions.
A number of neighborhoods in the City have extremely high rates of poverty, with well over half of residents living under the poverty line. This is important because communities with high concentrations of poverty are particularly harmful to those individuals who live in them. Studies have shown that children from poor families who live in high poverty neighborhoods and attend schools with high rates of poverty experience more trauma and have greater difficulties in life than equally poor children who live in less poor areas. They are also more likely to live in poverty as adults. Adults who reside in high poverty areas are more likely to experience health issues, have less accessibility to jobs and other services, and have less economic mobility.
Living in poverty is bad, but living in poverty in areas with lots of other people in poverty is considerably worse. Unfortunately, that is the situation in Rochester today.
How do we try to reduce poverty?
Most efforts to decrease rates of poverty can largely be divided into two broad categories, with a fair bit of intersection between the two.
First, there are those programs that directly provide cash and non-cash supports to individuals and families. These programs are often federally funded, sometimes with state and local support. Social Security lifts millions of Americans out of poverty. Food Stamps (officially known as SNAP), Child Care Subsidies, and Housing Choice Vouchers provide critical supports to countless low-income Americans. The EITC increases the value of work and provides critically needed financial resources to low-income families through the tax system. The Temporary Assistance to Needy Families (TANF, also known as welfare) program, although diminished since the mid-1990’s, still provides time-limited cash assistance to many families and individuals. As noted above, only some of these supports are included in the official poverty measure. However, all of these programs (while imperfect) reduce the harmful impact of poverty on those individuals who receive them.
Second, there are those efforts that aim to increase the market income of low-income individuals. After all, the most stable and lasting solution to poverty for most working age people is a good job. Some of these initiatives focus on furthering the education and skills of the low-income workforce through education and job training programs. Other efforts center on attracting and sustaining businesses and broader economic development in a region. These types of initiatives are often locally led, although communities such as ours do receive significant state and federal funding for education, job training, and business development efforts.
In this series, we are going to explore this issue from another angle. Specifically, how an increasingly dispersed regional economy that is dependent on car ownership limits the economic mobility of low-income individuals. We will also offer a better path forward. Continue reading, Part 3: The Long Bus Commute and the Value of Time…
