Posted by: Mike Governale, president and co-founder of Reconnect Rochester
Just about every day on the local news we hear about a crime that took place somewhere in our community. And usually after that news you’ll often hear a traffic report… “An accident at the I-590 split has traffic backed up ALL the way to 104. You better give yourself some extra time for your commute this morning!”
What we don’t often hear about—or think about—are the lives that were impacted as a result of that car crash that has inconvenienced our drive.
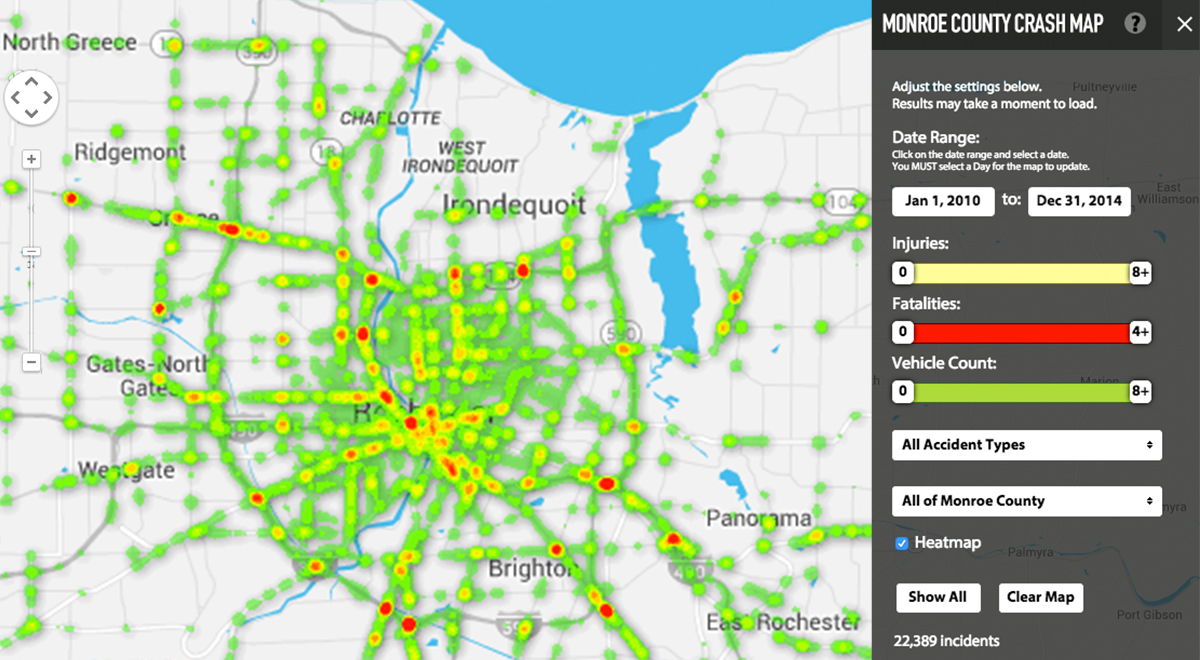
Now here’s something that might help put your daily traffic report in perspective: between 2010-2014 there were 22,389 car crashes in Monroe County which resulted in at least one injury or fatality. The volunteers at Reconnect Rochester have been hard at work collecting that data. And a new “Crash Map” ![]() they’ve created is revealing an enormously high human toll on our local roadways…
they’ve created is revealing an enormously high human toll on our local roadways…
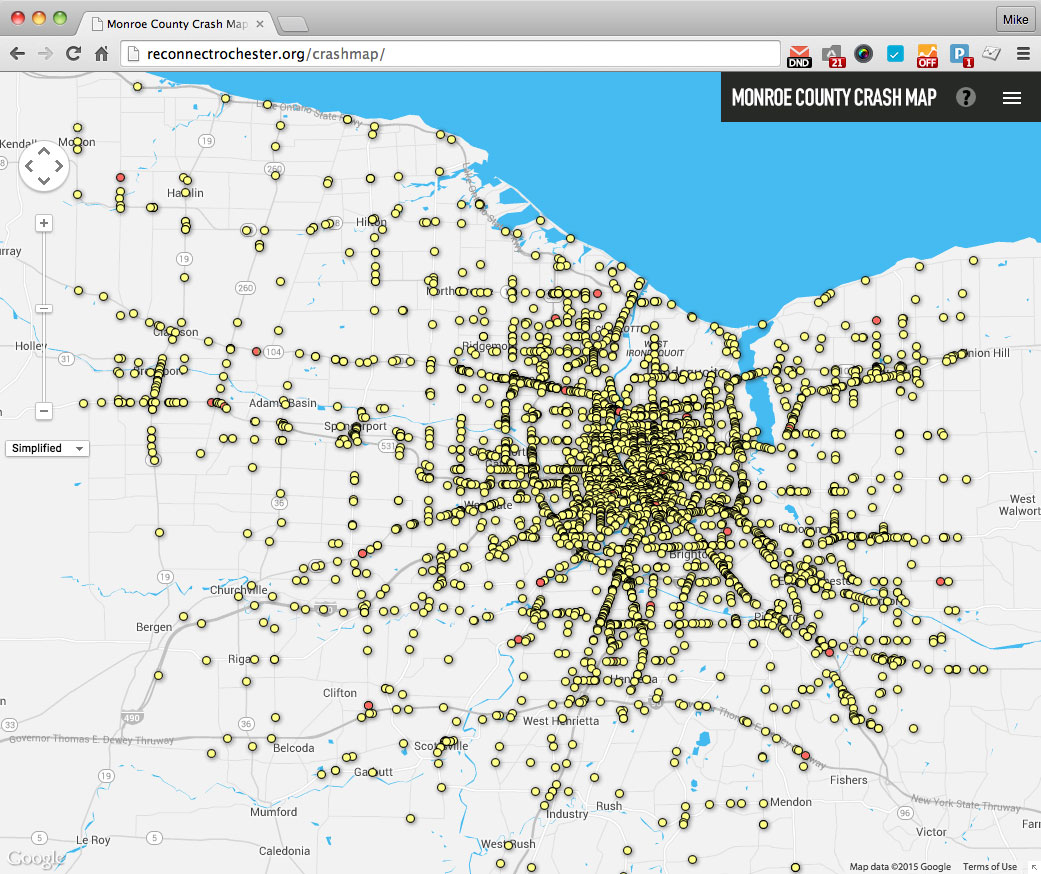
This Monroe County Crash Map ![]() allows the general public to plot crash data on a Google map. You can also filter the results using a variety of category settings including the type of crash, date range, vehicle count, and the town in which the incident took place.
allows the general public to plot crash data on a Google map. You can also filter the results using a variety of category settings including the type of crash, date range, vehicle count, and the town in which the incident took place.
Previous maps and reports on this topic typically included only traffic fatalities and ignored injuries. This is like trying to view Lake Ontario through a pinhole.
In 2014, for example, Monroe County saw 27 fatal crashes. By including the 4,077 incidents that resulted in people being hurt, this new tool gives a more complete picture of just how dangerous our roadways can be.
Our streets and highways are intended to carry people safely to their destination. Life-altering car crashes are occurring every day in our area. This is an epidemic that looms larger in Rochester than violent crime, yet we allow careless driving habits and poorly designed roads to go largely ignored.
Even a non-life-threatening injury can have lasting impacts on individuals and families. According to Centers for Disease Control and Prevention ![]() the cost of medical care and productivity losses associated with injuries from motor vehicle crashes in the U.S. exceeded $80 billion in 2010 or nearly $500, for each licensed driver in the United States.
the cost of medical care and productivity losses associated with injuries from motor vehicle crashes in the U.S. exceeded $80 billion in 2010 or nearly $500, for each licensed driver in the United States.
The intent of this map is not to frighten people. By taking this data which is rarely ever released to the public, and presenting it in a way that is both visual and highly interactive, we hope you will engage with it and use it to do something productive with.
Renee Stetzer, chair of Reconnect Rochester’s complete streets committee said, “This Crash Map gives Rochesterians a powerful new tool with which to raise awareness of traffic safety issues, identify potential problem spots in their own neighborhoods, and take appropriate action.”
Development of the map was donated by Livadas Consulting ![]() , a Rochester, NY-based digital agency. Founder, Nicholas Livadas said, “We live in a time of unprecedented connectivity, capturing data faster than we can draw meaning from it. It’s important that we take time to reflect on the big picture. Our behavior is often influenced by visualized data and our wellness correlates to our access to, and understanding of unbiased information.”
, a Rochester, NY-based digital agency. Founder, Nicholas Livadas said, “We live in a time of unprecedented connectivity, capturing data faster than we can draw meaning from it. It’s important that we take time to reflect on the big picture. Our behavior is often influenced by visualized data and our wellness correlates to our access to, and understanding of unbiased information.”
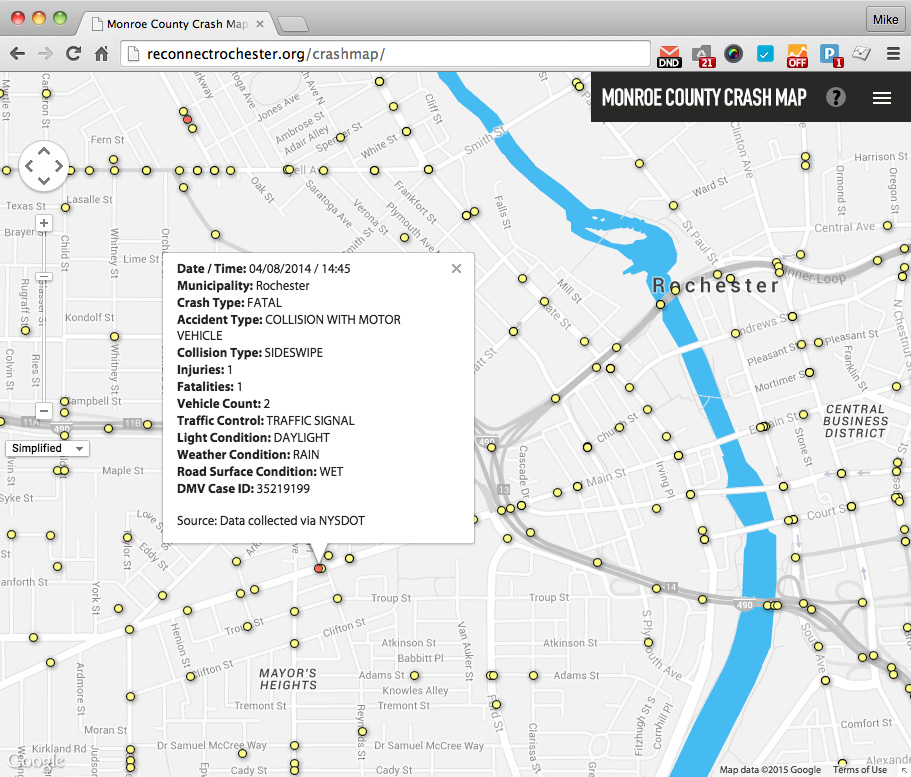
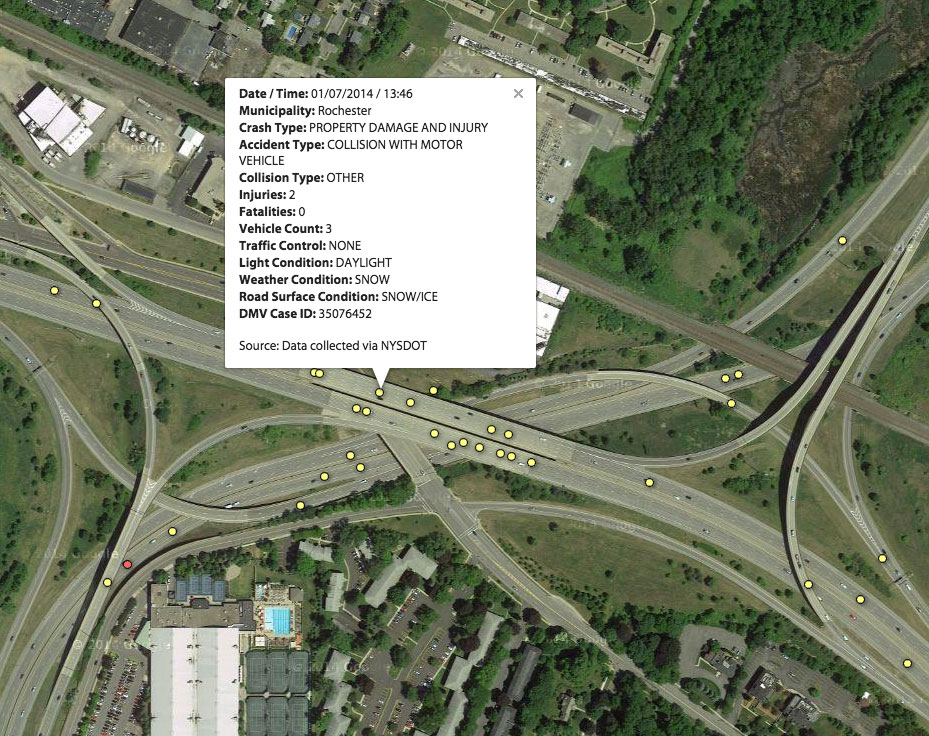
The Crash Map data can be sliced up and viewed in an infinite number of ways. For example, you can find all the incidents that took place in your town, or on your own street. Or see how many incidents involved pedestrians or cyclists.
Reconnect Rochester plans to update Crash Map ![]() annually as new data becomes available. We hope you’ll take some time to work with it, and let us know what you think.
annually as new data becomes available. We hope you’ll take some time to work with it, and let us know what you think.
This is fantastic, where is the data from? I don’t see it available on the NYS DOT site.
Thanks Adrian. The data was provided to us by NYSDOT. As far as we could find, it’s not published anywhere. We had to specifically request the data under the Freedom Of Information Law.
I’m so excited to see this launch! In addition to being a valuable tool for planners and leaders, it empowers regular everyday people who are just trying to make their neighborhoods safer for everyone who lives and passes through there.
Nice work!
It was a delight working with Mike and Reconnect Rochester on the map! I wrote up a little FAQ about it here: http://livadas.consulting/crashmap-about
This is so great. It will be really handy in the future once more data is loaded to see how something like the roundabouts installed on 590 in Irondequoit, for example, can affect the number of accidents.
This is good data to have. I have a couple of teens who are learning to drive, so I know what areas to tell them to use caution or to stay away from.